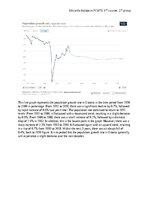
This line graph represents the population growth rate in Estonia in the time period from 1950 to 2100 in percentage. From 1951 to 1959, there was a significant decline by 0.7%, followed by rapid increase of 0.6% two years later. The population rate continued to return to 1951 levels. From 1961 to 1980, it fluctuated with a downward trend, resulting in a slight decrease by 0.6%. From 1980 to 1988, there was a small increase of 0.1%, followed by a dramatic drop of 1.9% in 1992. In addition, this is the lowest point in the graph. However, there was a sharp increase of 2.3% from 1993 to 1999. It fluctuated again with an upward trend, resulting in a rise of 0.7% from 1999 to 2018. …