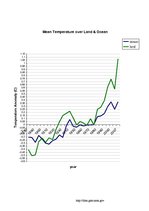
Today I`m going to describe the graph of Mean Temperature Changes for Land and Ocean.
My presentation will take around 4 minutes. Please, feel free to interrupt me during the presentation if you have any questions.
The vertical axis represents the temperature in Celsius. You can see from the key which line indicates the mean temperature for land and which for ocean.
This chart shows a substantial increase of the global mean temperatures for last 127 years. If you look closely at this graph, you will notice that the mean land temperature was equal to -0.4 in 1880. The figures hitted a low during next 5 years when the situation had improved and the temperature recovered significantly to 0.2.
Moving on to the next 10 years the figures fluctuated and soared suddenly in 1940. As a result this period was called as a global warming.…