Underground Station Passenger Numbers
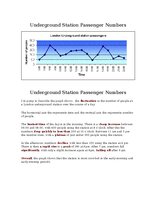
I’m going to describe the graph shows the fluctuation in the number of people at a London underground station over the course of a day.
The horizontal axis the represents time and the vertical axis the represents number of people.
…