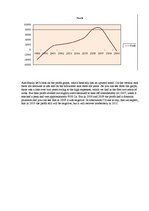
And finally let’s look on the profit graph, which basically has an upward trend. On the vertical axis there are amounts in lats and on the horizontal axis there are years. As you can see from the graph, there was a loss over two years owing to the high expenses, which we had in the first two years of work. But then profit leveled out slightly and continued to take off considerably till 2007, when it reached a peak and was approximately 9000 Ls. But in 2008 and 2009 the profit had a dramatic plummet and you can see that in 2009 it was negative. In conclusion I’d like to say, that we expect, that in 2010 the profit still will be negative, but it will recover moderately in 2011.…